Assessment results
Inspection reports, from both Ofsted and SIAMS, will help you form a judgement about how well we perform as a school, but they can never give a complete picture, and they can be several years behind the developing story of a school community.
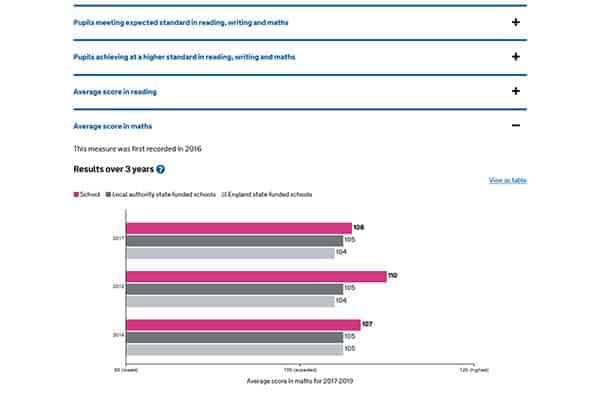
Usually the latest assessment results are published nationally in December each year (though sometimes it takes longer for results to appear): the results for each individual school are published, and to help put those results in context, there are also national results and results for each local authority. So you can compare our performance with the county and national averages. Results for individual children are never published.
Understanding the data
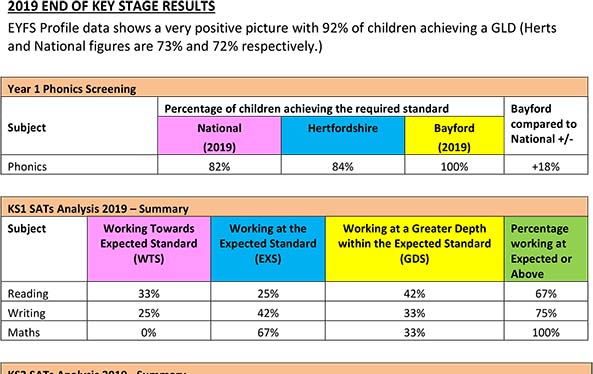
The results published for primary schools are taken from the assessments (SATs) made at the end of Key Stage 2, when pupils are in their final year in primary school, year 6.
It isn’t always easy for a non-specialist to understand the data, but here are a few key points to help, and we are always happy to answer questions, so do get in touch!
Results for any individual school will often vary a lot from year to year, but that doesn’t mean the school is suddenly getting better or worse. Results are published as percentages, but in a small school like Bayford, with only 15 children at most in the assessment group, each child counts as almost 7% or more! Year groups naturally vary in ability, sometimes quite a bit, so one or two more children reaching, or not reaching, a particular standard, compared with the previous year, can look misleadingly like a dramatic change in the school’s performance. A broader view across several years, and a comparison with other schools across the same timeframe, can give a more balanced view of how we’re doing and how we’re developing.
There are plenty of sites giving information about how the assessment process works, but the Department for Education is often a good place to start and you can download or view for parents using the button below.
Our KS2 SATs results in 2024
There are two ways in which you can look at our most recent assessment data. You can read them, or directly download a summary of the information from this page, or you can follow the link to the national school and college performance tables, where you can see our assessment results. Please note that the official tables are often updated well after the event: for example, our summer 2023 results were only published in April 2024 (the normal timetable is for results to appear in the December following the tests). We aim to publish our results here in the autumn term following the tests. If you would like to ask us any questions about the figures, please do contact us!
Bayford KS2 SATs 2024
| School | National Average | |
| Reading EXS | 90.9% | 60.6% |
| Reading GDS | 9.1% | 28.5% |
| Reading Average Scaled Score | 105.5 | 105 |
| Writing EXS | 63.6% | 71.8% |
| Writing GDS | 9.1% | 12.9% |
| Maths EXS | 81.8% | 73.1% |
| Maths GDS | 9.1% | 23.8% |
| Maths Average Scaled Score | 104.2 | 104 |
| Grammar, Punctuation & Spelling EXS | 90.9% | 72.2% |
| Grammar, Punctuation & Spelling GDS | 27.3% | 31.9% |
| Grammar, Punctuation & Spelling Average Scaled Score | 104.4 | 105 |
| RWM EXS Combined | 54% | 60.6% |
| RWM GDS Combined | 0% | 7.6% |
Key
An average scaled score of 100 or more means that on average the children in the school are working at, or above, the expected standard for the key stage. The average scaled score is calculated as the mean scaled score of all pupils awarded a scaled score. Pupils who did not take the test or took the test but did not receive a scaled score are excluded.
EXS
Expected standard. The table above shows the percentage of our children who took KS2 SATs at Bayford in 2024 who were working at, or above, the expected standard for children of their age.
GDS
Working at greater depth within the expected standard. The table above shows the percentage of our children who took KS2 SATs at Bayford in 2024 who were working at greater depth within the expected standard for children of their age.
This page was last updated on 22nd November 2024